Hover over the screenshots to see a list of the available maps.
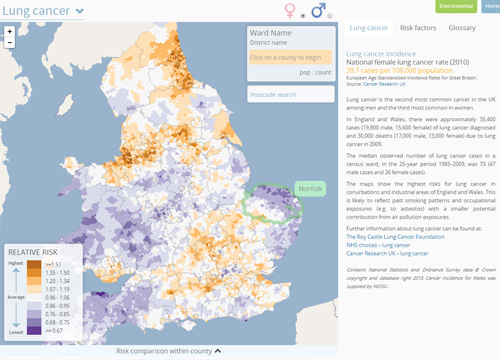
Health conditions The fourteen health conditions are mapped at small-area (census ward) level. They show relative risks (the risk in a census ward relative to the risk in England and Wales) averaged over a 25 year period (1985-2009) where possible. Maps are presented separately for males and females. These are adjusted for age, deprivation and chance fluctuations due to small numbers. The health maps produced were developed specifically for the Atlas. Unlike most other UK atlases (e.g. at district, NHS board or primary care trust level), this atlas provides health maps at census ward level (average population 6,000), giving a high degree of spatial resolution to better show geographical variability.
How to use the health outcome maps: Either enter a postcode or click through to a ward. The colour shows the relative risk category for each specific outcome for the ward or the ward containing that postcode. The middle category (in white) represents a risk similar to the average for England and Wales. The purple areas represent areas where the risk is below the average and orange areas represent areas where the risk is above average. The chart below the maps ranks that ward (with the statistical confidence) with all other wards within the same county. Help with how to interpret relative risks can be found in Section 4 in the Sense About Science publication ‘Making Sense of Statistics’ and in the article by Professor David Spiegelhalter ‘2845 ways to spin the risk’ on the Understanding Uncertainty website.
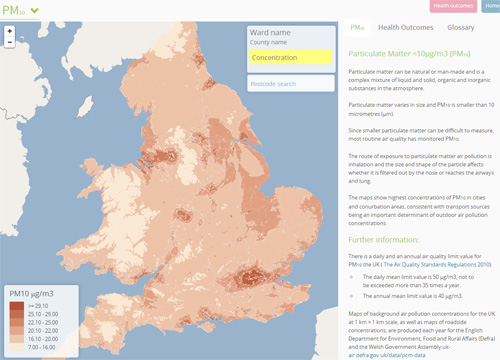
Environmental agents A range of selected environmental agents are presented at the highest available spatial resolution on a national scale. These maps represent environmental agents at specific time periods up to 2005 but may not be representative of current levels.
How to use the environmental agent maps: Each map shows a different environmental agent. The postcode search allows you to see the estimated concentrations (or related measures) for each agent. Further information on the methods used to create these maps and more details on how to interpret them can be found here.
